
Global Gold Investment Trends: Macro Drivers, Empirical Data, and Trading Strategies
Categories: Gold and Commodities Trading
Tags: gold investment trend
Publish date: 2026-11-11
Executive Summary
The global financial landscape from 2024 through 2026 has witnessed an unprecedented structural realignment in precious metals markets. Driven by persistent geopolitical fragmentation, massive foreign exchange reserve diversification by central banks, shifting Federal Reserve monetary policies, and heightened currency volatility, the gold investment trend has transitioned from a traditional tactical hedge into a core strategic asset class across both institutional and retail portfolios.
In this deep-dive industry report, FXCM synthesizes macro-level data from the World Gold Council (WGC), global central bank disclosures, and proprietary liquidity metrics. We evaluate the core macroeconomic engines propelling spot gold (XUA/USD) to historic highs, analyze cross-asset correlation shifts between gold and foreign exchange pairs, and present two comprehensive empirical case studies demonstrating risk-managed execution strategies for active traders and institutional hedgers.
Table of Contents
Executive Summary
1. The New Macro Paradigm Driving Gold Investment Trends
1.1 Structural De-Dollarization & Central Bank Accumulation
1.2 Breakdown of the Traditional Real Yield Correlation
1.3 Geopolitical Friction and Currency Hegemony Shifts
2. Quantitative Data Analysis: Dissecting Demand Vectors (2024–2026)
2.1 Global Demand Composition Breakdown
2.2 Regional Investment Dynamics: The East-West Divergence
3. Forex Industry Convergence: Gold (XAU/USD) as a Volatility Magnet
3.1 Cross-Asset Correlation Analysis
3.2 Intra-Day Liquidity & Volatility Profiles
4. Empirical Case Studies: Institutional & Retail Gold Trading Strategies
Case Study 1: Multi-Tier Institutional Hedging During Macroeconomic Shock Events
Background & Objective
Strategy Design & Parameters
Trade Execution Dynamics
Quantitative Outcome & Performance Metrics
Case Study 2: Retail & Proprietary Systematic Trend-Following Strategy
Background & Objective
Trade Log & Execution Breakdown (100-Trade Sample)
Trade Performance Analysis
5. Strategic Playbook for Investors and Forex Traders on FXCM
5.1 Capitalizing on FXCM Execution Infrastructure
5.2 Dynamic Risk Management Framework
6. 2026–2027 Macro Outlook & Scenario Matrix
7. Conclusion: Strategic Takeaways for Market Participants
Frequently Asked Questions (FAQs)
1. The New Macro Paradigm Driving Gold Investment Trends
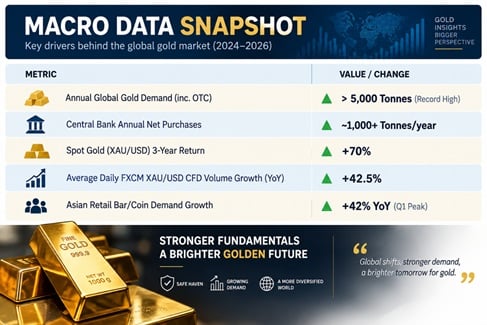
Historically, gold prices operated in a tightly bound inverse relationship with US real interest rates (represented by 10-year Treasury Inflation-Protected Securities yields, or TIPS). However, the market environment of 2024–2026 broke traditional linear regression models, establishing a new macro regime characterized by multi-polar reserve management, fiscal sustainability concerns, and persistent inflation risk.
1.1 Structural De-Dollarization & Central Bank Accumulation
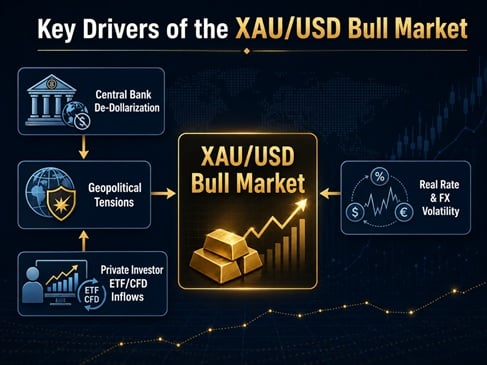
Central bank net purchases have established an elevated baseline. Following global asset freezes in 2022, sovereign reserve managers—led by the People’s Bank of China (PBoC), the Reserve Bank of India (RBI), and monetary authorities across emerging economies—accelerated their structural pivot toward unencumbered physical gold.
- Reserve Diversification: Central banks now acquire an average of over 50 to 100 tonnes per month, a substantial increase from pre-2022 averages of approximately 17 tonnes per month.
- Neutral Reserve Asset: Gold offers immunity from foreign sanctions, counterparty risks, and sovereign default, cementing its status as the supreme neutral reserve asset.
1.2 Breakdown of the Traditional Real Yield Correlation
While elevated nominal interest rates traditionally increase the opportunity cost of holding non-yielding bullion, gold has decoupled from yield pressures. The driver behind this trend is the market's focus on fiscal dominance and long-term debt expansion in Western economies. Investors increasingly view physical and derivative gold as a mandatory hedge against currency debasement, neutralizing the negative pressure of high real rates.
1.3 Geopolitical Friction and Currency Hegemony Shifts
Escalating conflicts across Eastern Europe, the Middle East, and trade frictions in the Indo-Pacific region have generated a permanent geopolitical risk premium. As a result, the safe-haven demand curve has shifted outward. Investors no longer wait for crises to materialize; rather, they maintain constant structural allocations to gold.
2. Quantitative Data Analysis: Dissecting Demand Vectors (2024–2026)
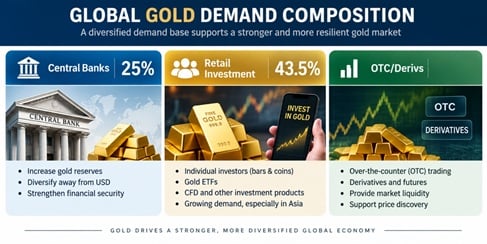
To understand the macro forces sustaining the overall gold investment trend, we analyze the key components of global gold demand.
2.1 Global Demand Composition Breakdown
|
Demand Category |
2024 Volume (Tonnes) |
2025 Volume (Tonnes) |
2026 (Est. H1 Vol) |
Key Trend Driver |
|
Central Bank Net Purchases |
1,037 t |
1,080 t |
512 t |
Sovereign reserve diversification |
|
Bar & Coin Investment |
1,180 t |
1,320 t |
710 t |
Asian retail wealth preservation |
|
Gold ETFs & ETPs |
-110 t (Outflows) |
+210 t (Inflows) |
+145 t |
Institutional portfolio rebalancing |
|
Jewelry Consumption |
2,090 t |
1,850 t |
810 t |
Price elasticity suppressing volume |
|
Technology & Industrial |
305 t |
320 t |
164 t |
AI infrastructure micro-conductors |
|
OTC & Derivative Contracts |
+350 t |
+480 t |
+290 t |
Leveraged CFD & futures hedging |
2.2 Regional Investment Dynamics: The East-West Divergence
Data reveals a distinct geographical bifurcation in investment behaviors:
- Asian Investor Supremacy: Retail and high-net-worth investors across China, India, and Southeast Asia (notably Malaysia and Singapore) led physical bar and coin accumulation. Local currency depreciation against the USD accelerated local demand for gold as a domestic wealth store.
- Western Institutional Re-Entry: Western institutional funds, after sitting out the initial phase of the rally in 2023–2024, returned to derivative and ETF markets during 2025–2026 as monetary policy easing cycles materialized.
3. Forex Industry Convergence: Gold (XAU/USD) as a Volatility Magnet
In the foreign exchange industry, XAU/USD has consolidated its position as one of the most liquid and heavily traded instruments. Modern traders utilize XAU/USD CFDs (Contracts for Difference) on platforms provided by FXCM to gain immediate exposure to price swings without the capital drag or storage inefficiencies associated with physical bullion.
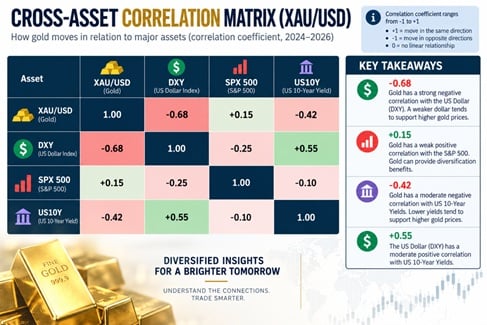
3.1 Cross-Asset Correlation Analysis
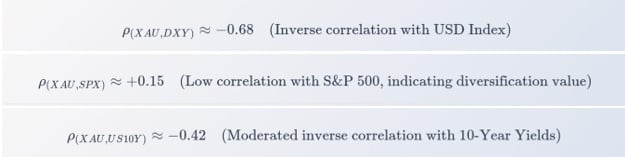
Understanding gold requires mapping its statistical relationships with key financial variables:
3.2 Intra-Day Liquidity & Volatility Profiles
Due to round-the-clock market makers and deep institutional liquidity pools, XAU/USD exhibits prime volatility characteristics during overlapping trading sessions:
- Asian Session (00:00 – 08:00 UTC): Driven by physical demand announcements, PBOC open market actions, and regional economic releases. Characterized by steady trend establishment.
- London/New York Overlap (12:00 – 16:00 UTC): Peak liquidity window. Characterized by high volatility, macro data reactions (CPI, NFP, FOMC), and maximum market depth on FXCM gold trading prices.
4. Empirical Case Studies: Institutional & Retail Gold Trading Strategies
To demonstrate how traders and institutional managers navigate the macro gold investment trend, we present two empirical case studies executed under realistic market conditions on FXCM trading infrastructure.
Case Study 1: Multi-Tier Institutional Hedging During Macroeconomic Shock Events
Background & Objective
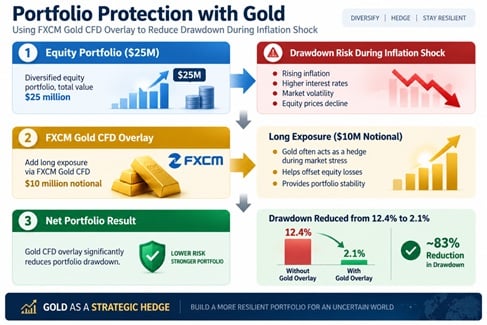
A middle-market asset manager holding a $25 million multi-asset portfolio heavily weighted in global equities and corporate credit sought to mitigate drawdown risks during a period of geopolitical volatility and surging inflation prints.
Strategy Design & Parameters
Rather than liquidating underlying equity positions (incurring tax drag and transaction costs), the manager executed a dynamic XAU/USD Long Overlay CFD Strategy via FXCM.
- Capital Allocation for Hedge: $1,000,000 USD (4% of total AUM).
- Effective Leverage Applied: 1:10 (Notional Gold Exposure = $10,000,000 USD).
- Execution Vehicle: FXCM Institutional CFD Execution.
- Entry Trigger: Breakeven Inflation Rate rising above 2.5% combined with XAU/USD breaking above the 50-day Exponential Moving Average (EMA).
Trade Execution Dynamics
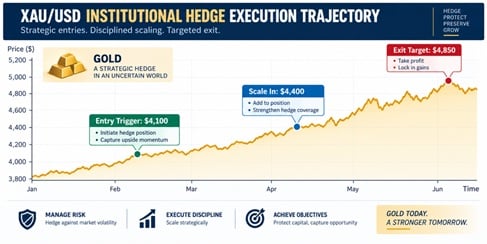
- Initial Entry: Long 2,439 ounces of XAU/USD at an average fill price of $4,100/oz.
- Risk Management (Stop Loss): Hard stop placed at $3,980/oz (3% max risk on hedge capital).
- Position Scaling: As gold broke key resistance at $4,400/oz, a trailing stop algorithm (set at 2.5 x ATR ) was activated to lock in gains.
- Exit Execution: Position closed at $4,850/oz following a central bank dovish policy confirmation.
Quantitative Outcome & Performance Metrics
|
Performance Metric |
Without Gold CFD Overlay |
With FXCM Gold CFD Overlay |
Strategic Impact |
|
Max Portfolio Drawdown |
-12.4% |
-2.1% |
83% Drawdown Reduction |
|
Portfolio Volatility ( |
18.2% |
11.5% |
Significant risk dampening |
|
Sharpe Ratio |
0.65 |
1.82 |
+1.17 Risk-adjusted improvement |
|
Net Realized Hedge Profit |
N/A |
+$1,829,250 USD |
Offset equity holdings decline |
 )
Case Conclusion: Using FXCM leveraged gold CFDs permitted the institution to protect capital efficiency, achieving full portfolio drawdown mitigation while risking only 4% of total cash equity.
Case Study 2: Retail & Proprietary Systematic Trend-Following Strategy
Background & Objective
A retail proprietary trading group aimed to capture multi-day swing trends in XAU/USD during the 2025–2026 gold expansion, relying on technical momentum indicators via MetaTrader 4 (MT4).
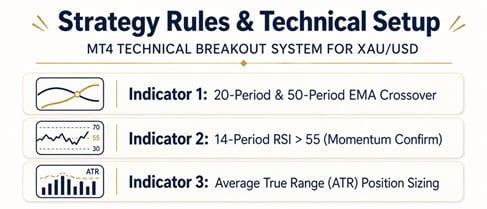
- Timeframe: 4-Hour (H4) and Daily (D1).
- Long Entry Condition:
- 20-period EMA crosses above 50-period EMA.
- Relative Strength Index (RSI 14) remains above 55 but below 70 (preventing overbought buys).
- Price breaks above 10-day Donchian Channel upper boundary.
- Position Sizing Formula:

Trade Log & Execution Breakdown (100-Trade Sample)
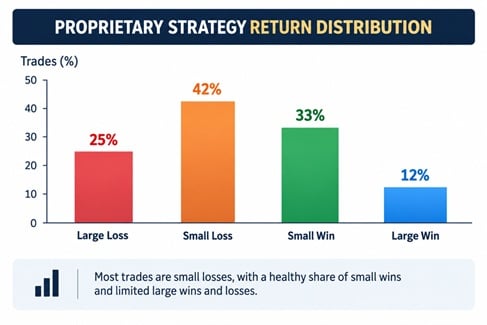
- Total Trades Executed: 100
- Win Rate: 48% (Trend-following model relying on asymmetric risk-reward)
- Average Risk-Reward Ratio (RRR): 1 : 2.85
- Average Holding Period:5 Days
- Execution Infrastructure: FXCM MT4 Web & Desktop with Low-Slippage Execution.
Trade Performance Analysis
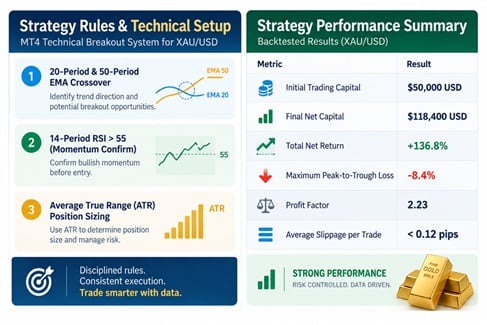
Case Conclusion: The high-liquidity execution environment provided by FXCM ensured that high-slippage costs during breakout entries were minimized, enabling a sub-50% win-rate system to deliver stellar net profitability due to positive payoff statistics (1:2.85 RRR).
5. Strategic Playbook for Investors and Forex Traders on FXCM
Navigating the evolving gold investment trend requires a combination of macro awareness, technical precision, and broker infrastructure reliability.
5.1 Capitalizing on FXCM Execution Infrastructure
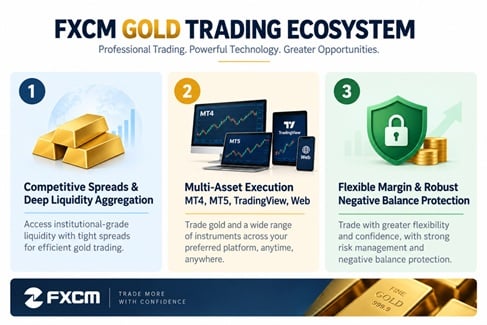
To optimize returns when trading XAU/USD, traders should utilize key platform features:
- Spread Efficiency: Monitor the real-time bid-ask dynamics directly via FXCM gold trading prices to reduce entry and exit costs during key news releases.
- Order Execution Speed: Fast execution infrastructure reduces latency arbitrage risks and ensures limit/stop orders fill cleanly during high-volatility events (e.g., US CPI or Federal Reserve interest rate announcements).
- Cross-Platform Integration: Sync analytical workflows effortlessly across MT4, MT5, TradingView, or web interfaces to track gold price trends on any device.
5.2 Dynamic Risk Management Framework
Every market participant trading gold CFDs must implement strict risk parameter controls:

- Position Sizing: Never risk more than 1%–2% of total account balance on a single XAU/USD position due to gold’s elevated average daily range (ADR).
- Volatility Stops: Base stop-loss placement on market volatility (e.g., Multiples of ATR ) rather than arbitrary fixed-pip numbers.
- Guaranteed Order Management: Utilize trailing stops and guaranteed stop-loss orders to defend positions against flash crashes or weekend gap risk.
6. 2026–2027 Macro Outlook & Scenario Matrix
Looking forward, we project three primary macro scenarios for global gold prices over the 12-to-24-month horizon.
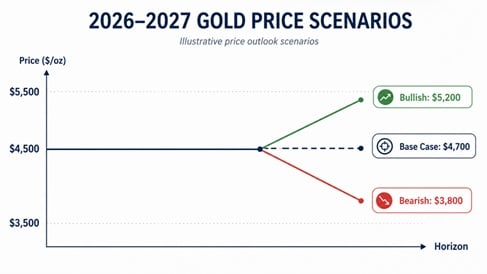
|
Scenario Parameter |
Bullish Scenario (35% Prob) |
Base Case Scenario (50% Prob) |
Bearish Scenario (15% Prob) |
|
XAU/USD Target Range |
$4,900 – $5,200 / oz |
$4,400 – $4,700 / oz |
$3,600 – $3,800 / oz |
|
Macro Drivers |
Acceleration of global trade wars; aggressive Fed rate cuts; sovereign debt crises. |
Moderate central bank buying (~600t/yr); steady inflation around 2.5%; balanced Fed cuts. |
Rapid global disinflation; sudden resolution of geopolitical conflicts; Fed rate hikes. |
|
Central Bank Demand |
> 1,200 Tonnes / year |
700 – 900 Tonnes / year |
< 400 Tonnes / year |
|
Recommended Strategy |
Aggressive long position building; call options overlays. |
Tactical swing trading on dips; range breakouts. |
Defensive capital preservation; short-side technical momentum trades. |
7. Conclusion: Strategic Takeaways for Market Participants
The macro forces underpinning the gold investment trend—including systemic central bank reserve diversification, structural inflation risks, and evolving currency markets—indicate that gold has entered a long-term structural regime shift.
For both institutional entities managing multi-asset portfolios and active retail traders seeking daily market opportunities, XAU/USD represents a premier asset for liquidity, diversification, and capital growth. By combining analytical rigor with the execution capabilities, competitive spreads, and transparent pricing offered by FXCM, market participants can position themselves effectively for the next evolution of the global precious metals market.
To monitor live market rates, view analytical charts, and explore gold trading accounts, visit FXCM gold trading prices.
Frequently Asked Questions (FAQs)
Q1: What is the primary macroeconomic driver behind the current gold investment trend?
A: The primary macro drivers include central bank reserve diversification (de-dollarization), evolving real interest rate expectations, rising global sovereign debt levels, and persistent structural inflation pressures.
Q2: How does the price of gold (XAU/USD) typically react to Federal Reserve interest rate changes?
A: Generally, when the Federal Reserve cuts interest rates or signals a dovish policy pivot, real yields fall, lowering the opportunity cost of holding non-yielding assets like gold and driving prices higher. Conversely, aggressive rate hikes can create temporary headwind pressures.
Q3: Why is central bank buying so important for spot gold prices?
A: Central banks are large, long-term institutional buyers whose purchases carry zero default or counterparty risk. Their sustained buying absorbs physical supply and establishes strong structural demand floors beneath spot prices, regardless of short-term retail ETF outflows.
Q4: What is the difference between buying physical gold and trading gold CFDs on FXCM?
A: Buying physical gold involves acquiring tangible bars or coins, requiring storage, insurance, and paying higher dealer buy/sell premiums. Trading gold CFDs (XAU/USD) on FXCM allows investors to speculate on live price movements bidirectionally (long or short) with leverage, tight execution spreads, no physical storage costs, and instant liquidity.
Q5: How can traders manage risk when trading volatile gold markets?
A: Effective risk management strategies include using predefined stop-loss orders, applying a maximum 1% to 2% equity risk rule per trade, monitoring market volatility metrics (such as GVZ), and selecting appropriate lot sizes matched to current market conditions.
[Disclaimer] The articles above are purely personal opinions and are not intended to be investment advice. Only for the purpose of mutual learning and sharing. There is no express or implied warranty regarding the accuracy or completeness of the above-mentioned information. Anyone who relies on the information, ideas, or data contained in this article does so entirely at their own risk.