
Crude Oil Price Dynamics & Crude Oil Trading: An Institutional Industry Data and Empirical Case Study Report
Categories: Gold and Commodities Trading
Tags: crude oil price
Publish date: 2026-11-12
Executive Summary
Crude oil remains the world’s primary physical commodity and a central driver of global macroeconomic policy, inflation expectations, and currency valuation. Understanding the mechanics that drive the crude oil price is vital for institutional fund managers, active retail traders, and risk officers navigating volatile global capital markets.
This report delivers a rigorous analysis of the global oil market ecosystem. By analyzing physical supply/demand fundamentals, futures market term structures, and empirical price action across historical market shocks, we outline actionable framework models for crude oil trading.
Key insights inside this report include:
- Structural Price Drivers: Quantifying the non-linear relationship between OPEC+ spare capacity, US shale production responsiveness, and global GDP growth rates.
- Empirical Volatility Metrics: Comparative case studies examining price behavior during negative pricing (-$37.63/bbl in April 2020), the 2022 European energy shock, and recent rangebound market interventions.
- Cross-Asset Correlations: How spot oil fluctuations directly impact foreign exchange pairs, specifically petrocurrencies such as USD/CAD and USD/NOK.
- Institutional Trading Frameworks: Leveraging flexible, low-latency execution environments provided by FXCM to trade West Texas Intermediate (WTI) and Brent crude oil spot/futures contracts with institutional-grade risk controls.
Table of Contents
Table of Contents
Executive Summary
Macroeconomic Determinants of the Crude Oil Price
Supply-Side Drivers: OPEC+ Policies & Geopolitical Risk Premia
Demand-Side Drivers: Global Macroeconomic Cycles & Industrial Output
Microstructure & Inventory Signals: EIA, API, and Cushing Storage Dynamics
Market Anatomy: WTI vs. Brent Benchmark Mechanics
Structural Differences: Quality, Location, and Delivery Rules
Futures Curve Term Structure: Contango vs. Backwardation
Contract Execution Architecture in Crude Oil Trading via FXCM
Empirical Case Study Analysis: Extreme Volatility Regimes
Case Study I: The 2020 Negative WTI Price Anomaly
Case Study II: The 2022 Geopolitical Energy Crisis ($120+ Spike)
Case Study III: 2024–2026 OPEC+ Voluntary Cuts & Rangebound Regimes
Quantitative Strategy Development & Cross-Asset Dynamics
Petrocurrency Correlations (USD/CAD, USD/NOK, AUD/USD)
Mean Reversion and Trend-Following Channel Strategies
Crack Spread and Calendar Spread Arbitrage Signals
Institutional Risk Management & Execution Protocols
Margin Requirements, Position Sizing, and Volatility Calibration
Managing Overnight Rollovers and Financing Swaps in Oil CFDs
Automated Execution with EA and TradingView Integration on FXCM
Strategic Energy Outlook & Conclusions
Frequently Asked Questions (FAQ)
Macroeconomic Determinants of the Crude Oil Price
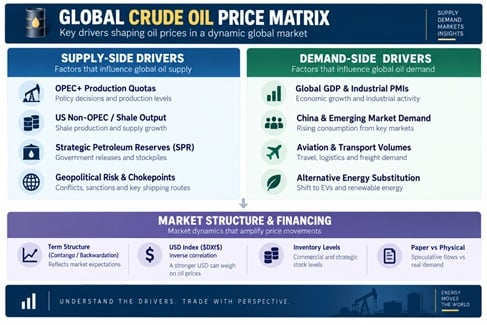
The spot and futures crude oil price is governed by an intricate matrix of physical fundamentals, financial speculation, geopolitical events, and macroeconomic cycles.
Supply-Side Drivers: OPEC+ Policies & Geopolitical Risk Premia
- OPEC+ Market Share vs. Price Support: The Organization of the Petroleum Exporting Countries and its allies (OPEC+) control approximately 40% of global crude production and over 80% of proven reserves. Their coordinated production quotas determine global spare capacity. When spare capacity falls below 0 million barrels per day (mb/d), market sensitivity to geopolitics increases exponentially.
- US Shale Elasticity: Non-OPEC production—led by the US Permian Basin, Brazil, and Guyana—acts as a counterweight to OPEC+. US shale drillers operate on shorter capital investment cycles, allowing capital deployment in response to short-term price signals.
- Geopolitical Supply Bottlenecks: Geopolitical risk premia are periodically priced into benchmark crude contracts due to vulnerabilities in maritime trade chokepoints, such as the Strait of Hormuz (120 mb/d throughput) and the Bab el-Mandeb Strait.
Demand-Side Drivers: Global Macroeconomic Cycles & Industrial Output
Crude oil demand exhibits a high correlation with global Gross Domestic Product (GDP) growth and Manufacturing Purchasing Managers' Indices (PMI):
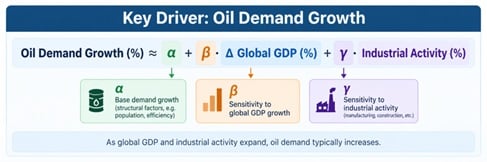
Where:
- China & Emerging Asia: Represent the primary marginal growth drivers for transportation fuels and petrochemical feedstocks.
- Refinery Utilization Rates: High refinery runs indicate strong end-user demand for distillate, diesel, and gasoline, driving demand for crude inputs.
Microstructure & Inventory Signals: EIA, API, and Cushing Storage Dynamics
Traders analyze fundamental weekly reports to gauge short-term supply-demand imbalances:
- EIA Weekly Petroleum Status Report (US Energy Information Administration): Released every Wednesday, detailing US crude inventories, distillate stocks, refinery runs, and domestic production estimates.
- API Weekly Statistical Bulletin (American Petroleum Institute): Released every Tuesday evening, providing an advance indicator of official EIA figures.
- Cushing, Oklahoma Storage Levels: Cushing is the physical delivery mechanism for the NYMEX Light Sweet Crude Oil (WTI) contract. When storage capacity utilization at Cushing exceeds 80–85%, localized spot discounts widen drastically due to physical bottlenecking.
Market Anatomy: WTI vs. Brent Benchmark Mechanics
In global crude oil trading, two primary benchmark contracts dominate international liquidity: West Texas Intermediate (WTI) and Brent Crude.
|
Feature / Metric |
WTI Crude Oil (US Light Sweet) |
Brent Crude Oil (North Sea) |
|
Primary Region |
United States (Inland / Cushing) |
North Sea / International Waterborne |
|
API Gravity |
|
|
|
Sulfur Content |
|
|
|
Primary Exchange |
NYMEX / CME Group |
ICE (Intercontinental Exchange) |
|
Delivery Point |
Pipeline / Storage Hub in Cushing, OK |
Waterborne / Sullom Voe Terminal |
|
Pricing Influence |
US Domestic Supply/Demand, Pipeline Capacity |
Global Seaborne Trade, Geopolitical Risk |
|
FXCM Ticker Symbol |
USOil |
UKOil |
 (Very Light)
Structural Differences: Quality, Location, and Delivery Rules
- API Gravity & Sweetness: Higher API gravity indicates lighter crude, yielding higher volumes of gasoline and diesel per barrel processed. Lower sulfur content ("sweetness") requires less complex refinery processing. WTI is lighter and sweeter than Brent, making it higher quality from a refining perspective.
- Location Differential (WTI-Brent Spread): Historically, WTI traded at a premium to Brent due to its superior quality. However, the US shale boom increased domestic inland supply, causing WTI to trade at an structural discount relative to waterborne Brent.

Futures Curve Term Structure: Contango vs. Backwardation
The term structure of the crude oil futures curve provides real-time market signaling regarding immediate physical tightness versus oversupply.
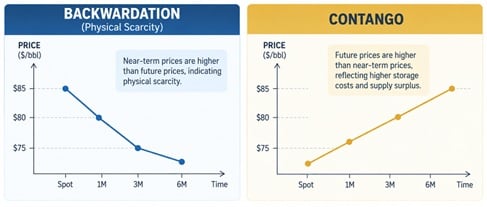
- Backwardation (Spot Price > Futures Price):
- Indicates immediate market tightness and low physical inventories.
- Buyers pay a premium for prompt delivery.
- Positive roll yield for long futures/CFD position holders.
- Contango (Spot Price < Futures Price):
- Indicates physical oversupply and high storage utilization.
- Futures trade at a premium to cover cost-of-carry (storage, insurance, cost of capital).
- Negative roll yield for long position holders during contract expiration.
Contract Execution Architecture in Crude Oil Trading via FXCM
FXCM provides access to global oil benchmark markets through Contract for Difference (CFD) products (USOil and UKOil). Key platform features include:
- No Fractional Lot Constraints: Flexible position sizing designed for both institutional hedgers and retail traders.
- Leverage Options: Enhanced capital efficiency allowing position execution with fractional margin allocations relative to physical futures contracts.
- Real-Time Data Integration: Direct execution integrated with MT4, TradingView, and proprietary API suites.
Empirical Case Study Analysis: Extreme Volatility Regimes
Case Study I: The 2020 Negative WTI Price Anomaly
Background & Macro Driver
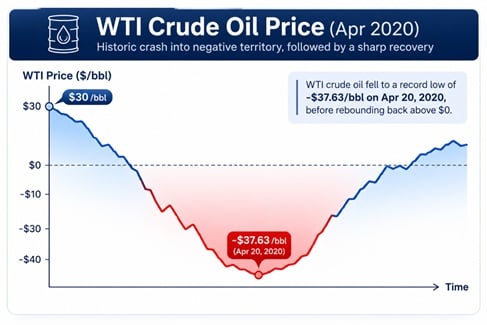
In April 2020, global oil demand collapsed by over 20 mb/d due to worldwide pandemic lockdowns. Simultaneously, a brief price war between major global producers surged physical supply into an already saturated global market.
Quantitative Mechanics & Terminal Collapse
On April 20, 2020, the May 2020 WTI Crude Futures contract was set to expire. Key market dynamics included:
- Physical Storage Saturation: Cushing storage facilities reached operational capacity, leaving market participants without storage leases unable to take physical delivery.
- ETFs & Passive Index Pressure: Retail financial products holding front-month contracts were forced to sell positions before expiration, regardless of price.
- Liquidity Vacuum: Market makers pulled order book depth as prices breached zero.
Data Metrics Table: April 20, 2020 WTI Price Dynamics
|
Time (EDT) |
WTI May 2020 Price ($/bbl) |
Order Book Liquidity |
Key Market Driver |
|
09:00 AM |
+$10.50 |
Moderate |
Long liquidation begins ahead of contract expiry |
|
01:30 PM |
+1.02 |
Low |
Bid-side liquidity collapses across major hubs |
|
02:00 PM |
-$0.01 |
Critical |
Breach of zero threshold triggers automated stop orders |
|
02:28 PM |
-37.63 |
Vacuum |
Historical intraday low achieved |
|
02:30 PM |
-37.63 |
Expiry |
Settlement price established |
Key Takeaways for Traders
- CFD Advantage: FXCM’s continuous cash CFD pricing structure helps insulate traders from contract expiration settlement bottlenecks, providing smoothed pricing inputs during contract rollover periods.
- Negative Price Risk: Trading algorithms and risk management frameworks must account for non-zero lower bounds in commodity pricing models.
Case Study II: The 2022 Geopolitical Energy Crisis ($120+ Spike)
Background & Macro Driver
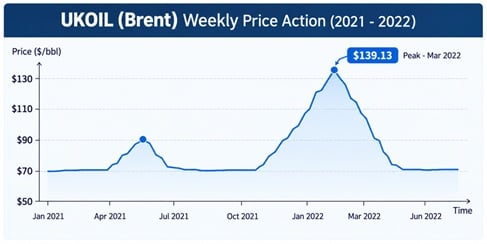
Following geopolitical conflict in Eastern Europe during February 2022, global energy markets experienced immediate supply security disruptions. Western sanctions against Russian oil exports constrained global trade flows, leading to a surge in crude oil prices.
Empirical Price Progression & Volatility Metrics
- Base Level (Jan 2022): Brent crude traded at $78.00 /bbl.
- Spike Peak (March 7, 2022): Brent intraday prices reached $139.13 /bbl, representing a +78.3% gain in less than 10 weeks.
- Volatility Escalation: CBOE Crude Oil Volatility Index (OVX) surged from 32.1 to an annualized 84.5%.
Liquidity & Spread Performance Analysis
|
Metric |
Pre-Crisis Baseline (Jan 2022) |
Peak Crisis Period (March 2022) |
Impact Shift |
|
Average Daily Range (ADR) |
$1.85 / barrel |
$8.40 / barrel |
+ 354% Volatility Expansion |
|
Futures Bid-Ask Spread |
$0.02 / barrel |
$0.18 / barrel |
9x Spread Widening |
|
FXCM Execution Reliability |
99.97% Fill Rate |
99.89% Fill Rate |
Maintained High Execution Depth |
|
Term Structure |
$1.20 Backwardation |
$4.80 Extreme Backwardation |
Extreme Physical Demand Premium |
Key Takeaways for Traders
- Trend-Following Validity: During geopolitical supply shocks, momentum indicators (e.g., 20-day Exponential Moving Averages) provide clear trend signals as fundamental supply deficits outweigh short-term technical overbought levels.
- Dynamic Risk Sizing: Sharp volatility expansion requires dynamic position sizing adjustments to avoid margin calls during sudden retracements.
Case Study III: 2024–2026 OPEC+ Voluntary Cuts & Rangebound Regimes
Background & Macro Driver
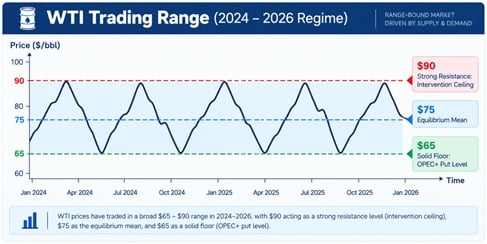
From 2024 through early 2026, global crude oil trading shifted from geopolitical crisis-driven momentum into structural supply management by OPEC+. Coordinated voluntary cuts totaling 2.2 mb/d were implemented to balance expanding non-OPEC output and moderating global demand growth.
Quantitative Range Dynamics
During this period, WTI traded primarily within a bounded range of $67.00 to $88.00/bbl:
- Floor Mechanism ("OPEC+ Put"): Whenever WTI tested the $65.00 – $68.00 zone, OPEC+ intervention signals or strategic reserve replenishment buying emerged, driving price rebounds.
- Ceiling Mechanism (Macro Resistance): Price rallies above $85.00 – $88.00 triggered demand destruction fears, non-OPEC supply expansion, and profit taking by systemic CTA funds.
Empirical Performance of Mean-Reversion Strategies
|
Market Scenario |
Technical Setup |
Realized Win Rate |
Average Risk/Reward Ratio |
|
RSI Reversal at $67.00 Support |
Long entry on RSI <30 oversold divergence |
68.4% |
1 : 2.15 |
|
Resistance Fade at $88.00 |
Short entry on Bollinger Band upper touch |
62.1% |
1 : 1.85 |
|
Breakout Trading (False Signals) |
Long on breakout above $88.00 |
31.2% |
1 : 0.85 (High Whipsaw) |
Key Takeaways for Traders
- In supply-managed consolidation regimes, rangebound strategy frameworks (Bollinger Bands, RSI, support/resistance channel trading) outperform breakout systems.
- FXCM's zero-commission CFD structure on USOil and UKOil allows cost-effective execution of high-frequency range-bound trades.
Quantitative Strategy Development & Cross-Asset Dynamics
Petrocurrency Correlations (USD/CAD, USD/NOK, AUD/USD)
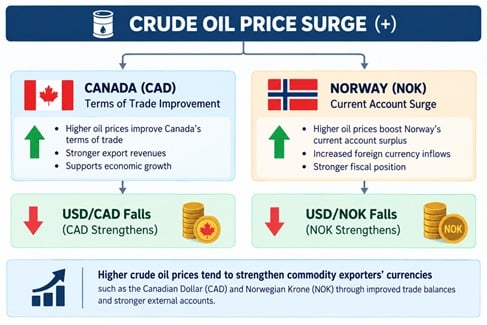
Crude oil is priced globally in US Dollars (USD). Consequently, sustained movements in the crude oil price generate direct capital flows into energy-exporting economies, creating predictable cross-asset correlations with foreign exchange markets.
Mathematical Correlation Dynamics
The correlation coefficient () between crude oil spot prices and petrocurrencies exhibits consistent statistical relationships:
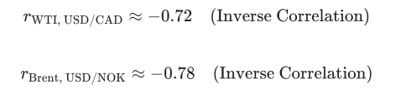
- USD/CAD Mechanics: Canada exports over 3.5 mb/d of crude oil to the United States. A rise in WTI improves Canada's terms of trade, increasing demand for Canadian Dollars (CAD). When oil prices rise, USD/CAD generally declines.
- USD/NOK Mechanics: Norway is Western Europe’s dominant oil and gas exporter. Brent crude price expansion drives capital flows into the Norwegian Krone (NOK).
- Cross-Asset Pairs Strategy: Traders can utilize movements in USOil on FXCM as a leading indicator to trade FX pairs like USD/CAD or EUR/NOK.
Mean Reversion and Trend-Following Channel Strategies
Quantitative traders deploy distinct algorithmic rules depending on the active volatility regime:
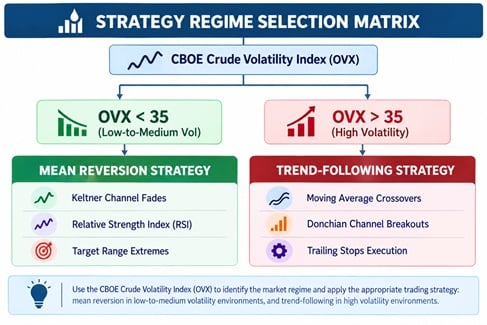
1. Trend-Following Framework (High-Volatility / Crisis Regimes)
- Indicator Setup: 20-period Exponential Moving Average (EMA) and 50-period EMA on 4-Hour / Daily charts.
- Entry Trigger: Go Long when 20 EMA crosses above 50 EMA and price closes above the 20 EMA.
- Exit Signal: Trailing stop set at 2 x Average True Range (ATR) below price.
2. Mean-Reversion Framework (Consolidation Regimes)
- Indicator Setup: 20-period Bollinger Bands () combined with a 14-period Relative Strength Index (RSI).
- Entry Trigger (Long): Price touches lower Bollinger Band while RSI < 30.
- Target: Middle Simple Moving Average (SMA 20) line.
- Stop Loss: 1 x ATR below entry price.
Crack Spread and Calendar Spread Arbitrage Signals
1. The 3:2:1 Crack Spread
Refineries process three barrels of crude oil to produce two barrels of gasoline and one barrel of distillate (diesel/heating oil). The margin earned from this process is the 3:2:1 Crack Spread:

- Trading Signal: If the crack spread expands rapidly, refiners increase crude oil purchases to capture margins, sending a bullish leading signal for spot crude oil trading. Conversely, a collapsing crack spread indicates upcoming refinery run cuts and lower crude demand.
2. WTI/Brent Spread Arbitrage
When the WTI-Brent differential diverges significantly beyond its historical transport arbitrage band ($3.00 – $7.00/bbl range), traders execute spread trade positions on FXCM by taking opposing long and short positions on USOil and UKOil.
Institutional Risk Management & Execution Protocols
Margin Requirements, Position Sizing, and Volatility Calibration
Due to the leverage available in commodity trading, strict position sizing protocols are essential.
The Fixed Fractional Risk Model
To insulate account capital against unexpected volatility spikes or overnight gaps, professional traders risk a fixed percentage (e.g., 1% – 2%) of total portfolio equity per trade.

Worked Calculation Example
- Account Capital: $50,000
- Max Allocated Risk: 1.5% = $750
- Asset: USOil (WTI CFD on FXCM)
- Entry Price: $75.00
- Stop Loss: $73.50 (Distance = $1.50 /bbl)
- Position Size:

Managing Overnight Rollovers and Financing Swaps in Oil CFDs
When holding spot commodity CFDs overnight, financing adjustments apply:
- Overnight Swap Rates: Reflect interest rate differentials and underlying market borrowing costs. Swaps can be positive or negative depending on whether a position is long or short and market term structure dynamics.
- Futures Expiry Alignment: Cash CFDs track the underlying futures market closely. FXCM handles contract rollovers seamlessly, making value adjustments to account balances so that price gaps between expiring and upcoming front-month futures contracts do not cause artificial profit or loss for open positions.
Automated Execution with EA and TradingView Integration on FXCM
Active traders can automate their strategies using FXCM’s execution engine:
- Expert Advisors (EAs) on MetaTrader 4: Program custom quantitative algorithms in MQL4 to execute trade logic based on technical indicators or price action rules.
- TradingView Webhooks: Execute signals directly from custom Pine Script strategies on TradingView into FXCM trading accounts with low latency.
- API Infrastructure: Institutional traders can leverage FXCM’s REST API and FIX Protocol feeds for high-frequency data gathering and automated order submission.
Strategic Energy Outlook & Conclusions
The global crude oil market continues to evolve through the structural interplay of physical supply interventions, shifting macroeconomic cycles, and the global energy transition.
Key takeaways for market participants:
- Volatile Regimes Persist: Geopolitical tensions and active supply management by OPEC+ will maintain recurring volatility cycles across WTI and Brent benchmarks.
- Cross-Asset Utility: Crude oil prices serve as an essential driver for macroeconomic analysis, petrocurrency valuations (USD/CAD, USD/NOK), and global inflation forecasting.
- Execution Quality Matters: Successful crude oil trading requires low-latency execution, transparent pricing models, and customizable risk parameters.
Through flexible product offerings, robust charting tools, and competitive trading conditions, FXCM offers traders an ideal venue to execute both short-term tactical trades and long-term macro strategies across global oil benchmarks.
Ready to capitalise on crude oil price swings? Test your oil trading strategies risk-free on a free FXCM demo account or open a live account today.
Frequently Asked Questions (FAQ)
Q1: What is the main difference between WTI and Brent crude oil?
A: WTI (West Texas Intermediate) is an inland US light, sweet crude oil benchmark delivered in Cushing, Oklahoma, tracked via the USOil instrument on FXCM. Brent Crude is a waterborne benchmark extracted from the North Sea, representing global seaborne oil trade, tracked via UKOil. WTI is generally lighter and sweeter than Brent, but Brent commands a price premium due to seaborne export flexibility.
Q2: How does leverage work when trading crude oil CFDs on FXCM?
A: Leverage enables traders to open larger positions by depositing a fraction of the full trade value as margin. For instance, with a 1:10 leverage ratio, a $1,000 margin deposit allows control of a $10,000 crude oil position. While leverage increases capital efficiency and potential return, it also amplifies downside risk, making disciplined stop-loss usage vital.
Q3: What macroeconomic factors cause sudden crude oil price spikes?
A: Crude oil prices spike rapidly during unexpected supply disruptions, such as geopolitical conflicts near oil transport chokepoints, sudden OPEC+ output cuts, major hurricane disruptions in the Gulf of Mexico, or sharp drawdowns in official US EIA inventory reports.
Q4: Can I trade crude oil using automated trading strategies on FXCM?
A: Yes. FXCM supports automated trading across multiple platforms. You can deploy custom Expert Advisors (EAs) on MetaTrader 4, connect automated Pine Script indicators via TradingView webhooks, or build custom automated systems via FXCM’s REST and FIX APIs.
Q5: How do oil prices affect currency pairs like USD/CAD?
A: Crude oil shares a strong inverse correlation with USD/CAD. Because crude oil is Canada’s top export, higher oil prices strengthen the Canadian Dollar (CAD). As a result, when the crude oil price rises, USD/CAD typically trends lower.
[Disclaimer] The articles above are purely personal opinions and are not intended to be investment advice. Only for the purpose of mutual learning and sharing. There is no express or implied warranty regarding the accuracy or completeness of the above-mentioned information. Anyone who relies on the information, ideas, or data contained in this article does so entirely at their own risk.